Top 5 Free Data Analytics Tools For Data Analysts !
Data analytics tools are software or platforms designed to collect, process, analyze, and visualize data to uncover meaningful insights from the data. These data analytics tools range from simple spreadsheet applications like Microsoft Excel to advanced yet user-friendly platforms like Python, R, Tableau, Power BI, and SQL-based tools. They enable us to clean unorganized raw data, perform statistical analysis, identify trends, and make data-driven decisions.
The data analytics tools are essential because raw data alone is usually messy and often holds little value until interpreted correctly. Using data analytics tools, businesses can improve their decision-making, optimize operations, identify new trends, and better understand trends and customer demands. Whether tracking website performance, analyzing sales patterns, or forecasting future trends, these tools transform data into a strategic asset and help individuals and organizations stay competitive in a data-driven world.
So, let’s deep dive into these data analytics tools and learn the basic usage and features about them. I have also provided the links of these data analytics tools for your better learning experience, therefore, don’t forget to check them out.
1. Microsoft Excel/ Google Sheets

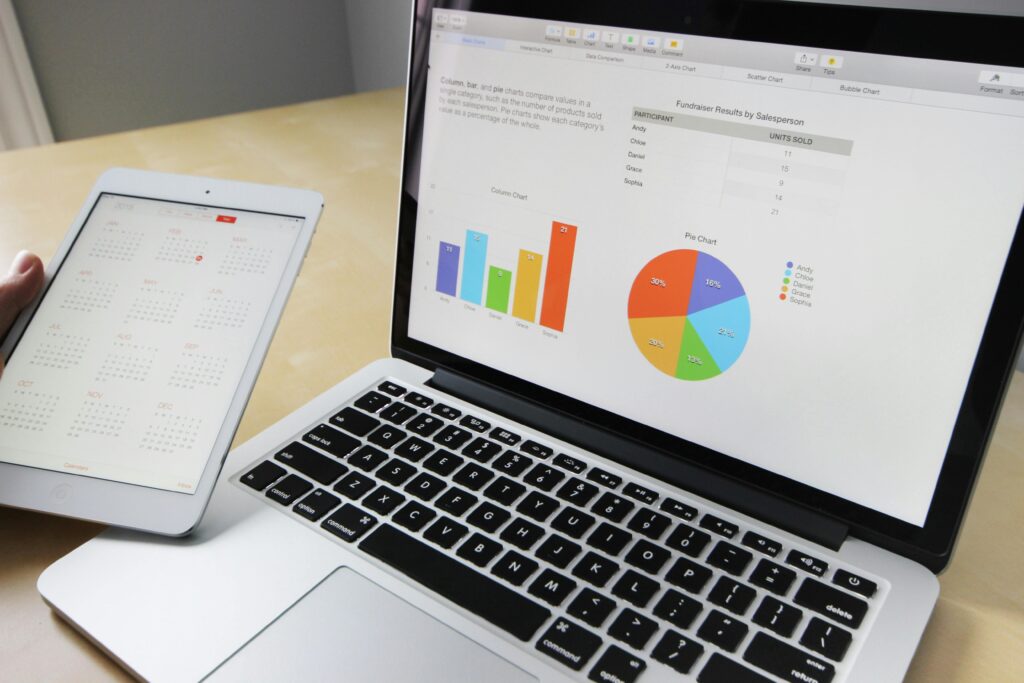
What is Excel?
Microsoft Excel is a spreadsheet application developed by Microsoft and it is a part of the Microsoft Office Suite, used for organizing, analyzing and visualizing data. Excelis one of the data analytics tools and uses a grid of rows and columns to manage data and perform various calculations, prepare charts and build complex data models.
Link: https://docs.google.com/spreadsheets/
Key Features:
- Formulas and Functions: Excel has built-in functions like SUM(), AVERAGE(), VLOOKUP(), etc.
- Data Validation: Controls data entry to maintain accuracy and helps users to summarize and analyze large datasets quickly.
- Macros and VBA: Automate repetitive tasks using Visual Basic for Applications.
- Collaboration: Users can share and co-author workbooks online through OneDrive or SharePoint.
Uses of Excel:
- Data Analysis and Visualization: Users can use tools like Pivot Tables, filters, do conditional formatting and visualize data as bar charts, pie charts, etc., to efficiently analyze the data.
- Data Management and Financial Modelling: Users can easily store and manage large datasets. Thus, it is widely used in accounting and budgeting purposes.
- Project Management and Reporting: Many companies use excel to make detailed reports for business purposes like tracking project timelines, resources and tasks assigned. One may also excel for academic and personal use.
Why Excel is so popular? (Bonus Points)
- Friendly User Interface: Excel is easy to learn for beginners and at the same time is a powerful tool for professionals due to it’s advance features.
- Integration: Excel works well with third-party tools like R, Python, etc. Microsoft keeps adding new features to Excel which allows users to work with it using different languages and tools.
- Versatility: Excel is useful across different industries like engineering, finance, data science, marketing, education, and more.
2. Power BI

What is Power BI?
Power BI is our second best among the data analytics tools, specifically, it is a business analytics tool developed by Microsoft that allows users to work with data and visualize it to make data-driven decisions. It converts the given raw data into interactive dashboards and reports, providing real-time insights for better decision making.
Link: https://app.powerbi.com/
Key Features:
- Drag and Drop Interface: User can build dashboards and reports without plotting charts and graphs by coding. You may easily drag and drop attributes to plot any sort of chart or graphs.
- Data Analysis Expressions – DAX: This is a powerful formula language for data modeling. Users may create relationships between different tables and build semantic models.
- Power Query Editor: Users can clean and transform data before loading it into reports. It enables users to reshape, and consolidate data without needing any advanced programming skills.
- Row-Level Security and Integration: Power BI seamlessly connects with Excel, Azure, SQL Server and various Microsoft tools. Also, one can control data access based on user roles.
Uses of Power BI:
- Data Analysis and Visualization: Users can use tools like Pivot Tables, filters, do conditional formatting and visualize data as bar charts, pie charts, etc., to efficiently analyze the data.
- Business Intelligence: Users can monitor key performance indicators(KPIs) and and trends to support strategic decisions.
- Project Reporting: One can generate and distribute detailed reports across teams or departments by creating interactive charts, graphs and dashboards.
- Real-Time and Predictive Analytics: You can integrate with machine learning models , AI features and connect to live data sources for up-to-the-minute insights on Power BI.
Why Power BI is so popular? (Bonus Points)
- Cloud-Based: You can easily publish and share dashboards online via cloud services. Being on cloud makes it scalable, thus, it is used individuals, startups and large enterprises alike.
- Free and Cross-Platform: Power BI is free to all type of groups, and accessible to all types of OS like Windows, iOS, Android and web browsers.
3. Tableau

What is Tableau?
Tableau is a data visualization and business intelligence tool developed to understand and analyze data visually. It allows us to create interactive dashboards like Power BI. Tableau connects to a wide variety of data sources and is known for its speed, flexibility, and use-friendly interface.
Link: https://public.tableau.com/app/discover
Key Features:
- Drag and Drop Interface: User can build dashboards and reports by little to zero coding. It has an interactive dashboard where you can drill down, filter, and highlight data points in real time.
- Data Source Support: User can connect to live data sources or use in-memory extracts for speed. Tableau can connect to Excel, SQL, Salesforce and much more.
- Tableau Prep: Its a tool for cleaning and preparing data before analysis.
- Map and Geospatial Data: Tableau allows user to to visualize location data with rich mapping capabilities.
Uses of Tableau:
- Data Analysis and Visualization: Users can use tools like Pivot Tables, filters, do conditional formatting and visualize data as bar charts, pie charts, etc., to efficiently analyze the data.
- Business Intelligence: Users can monitor key performance indicators(KPIs) and and trends to support strategic decisions.
- Operations Monitoring: Analyze real-time data to optimize operations and workflows.
- Academic Research: Widely used in education and research to visualize statistical findings.
Why Tableau is so popular? (Bonus Points)
- Optimized Performance: Tableau can handle large datasets efficiently with fast visual rendering.
- Cross-Platform: It is accessible to all types of OS like Windows, iOS, Android and web browsers.
- Community: It has a big community, active forums and regular conferences.
4. Kaggle

What is Kaggle?
Kaggle is most-loved among all data analytics tools. It is an online platform owned by Google that serves as a community and resource hub for data science and machine learning enthusiasts. It provides datasets, public notebooks, coding environments and various tools to learn, practice, and showcase your machine learning skills.
Link: https://www.kaggle.com/
Key Features:
- Kaggle Kernels: Also, known as Notebooks. Here, you can write and share Jupyter notebooks with built-in resources.
- Datasets: Kaggle provides you a huge variety of dataset which you can easily download and use.
- Discussion Forums: On Kaggle, you can collaborate, troubleshoot, and learn from peers and experts. You can also fork and reuse notebooks created by others.
Uses of Kaggle:
- Coding: You can run Python or R code in Jupyter Notebooks without local setup, i.e., on cloud.
- Dataset Repository: You can access various free, public datasets and share public notebooks and projects.
- Competitions and Community Collaborations: Compete in real-world problems hosted by companies and win prizes. Also, engage with fellow data scientists through community and kernel sharing.
Why Kaggle is so popular? (Bonus Points)
- Kaggle Courses: On Kaggle you can take free courses on Python, ML and Data Science.
- Free Learning: Kaggle is fully free and you can learn from basic coding to advance deep learning projects.
5. Apache Superset

What is Apache Superset?
Apache Superset is an open-source data exploration and visualization platform developed by Airbnb and now maintained under the Apache Software Foundation. It allows users to create interactive dashboards and charts on top of a wide variety of data sources, with a focus on scalability, speed, and extensibility. Superset is ideal for teams needing a lightweight but powerful alternative to traditional BI tools.
Link: https://superset.apache.org/
Key Features:
- Drag and Drop Interface: User can build dashboards and reports by plotting charts and graphs without coding.
- Role-Based Access Control(RBAC): Apache superset gives fine-tune access and permissions per user or group
- SQL Editor: You can write and execute queries directly in the browser.
- Lightweight and Fast: Apache Superset is optimized for speed and performance in enterprise settings.
Uses of Apache Superset:
- Self-Service BI: Apache Superset empower analysts and non-technical users to explore data without deep technical skills.
- Open-Source BI: Here, you can customize the platform for specific enterprise needs.
- Dashboard Publishing: Users can share insights securely within teams or organizations. You can also integrate dashboards into web apps or internal tools.
Why Apache Superset is so popular? (Bonus Points)
Flexible Deployment: You can run on cloud, on-premises, or in Docker environments.
- Enterprise-Friendly: Superset integrates with authentication systems and can handle large workloads.
Conclusion
In today’s world, data analytics tools like Microsoft Excel, Power BI, Tableau, Kaggle and Apache Superset have become essential to collect, analyze, visualize, and make decisions based on data. Each platform serves it’s own unique purpose like Excel is known for it’s simplicity whereas Tableau and Power BI are known for their business intelligence capabilities. Similarly, Kaggle is known for it’s collaborative learning environment and Apache Superset for it’s open-source flexibility.
However, these all data analytics tools are meant to help enthusiasts like you to transform raw data into meaningful insights for better decision making. Remember, choosing the right tool depends on your specific needs and that you can do by understanding the usage of all data analytics tools mentioned above.
Therefore, explore, experiment, and enhance your skills by doing practice on the mentioned data analytics tools.